GoAccess
Posted on October 3, 2022 • 5 minutes • 969 words • Other languages: Français
This blog is my personal digital space of freedom and, when I write articles, sometimes I just want to have an idea of how many people come to read me. That’s why I wanted to have simple and respectful statistics of my readers, and therefore to do what is more commonly called “analytics”.
To collect this statistical information, there are globally two main directions:
- The cookies
- The analysis of logs
Cookies are accurate, they can really identify a user but they require that my website (or a third party, hello Google Analytics 👋) deposits a file (the cookie) on the user’s PC in order to trace his usage of my website. This cookie deposit leads to the notion of collection of consent with the implementation of a cookie acceptance/refusal banner. The famous banners that pollute modern web browsing.
Log analysis**, on the other hand, is less accurate since it is based on the IP address of the visitor. Except that IP addresses can be shared by several people (NAT). Moreover, a person can use several IP addresses (VPN). Finally, it is less easy to distinguish bots from real users. On the other hand, via the log, we can **obtain the “Referer “** Referer , a request header that allows us to know the origin of the user: to know if he arrives on my site by DuckDuckGo, Google, Twitter or any other site that would contain a link to my blog.
Now, the question I’ve been asking myself is: Do I need to have accurate statistics to the nearest visitor for my personal blog? The answer is no, I just want to have an idea of the number of visitors and referrers (where the visitors come to my site).
In my case, here is what I care about:
- No third party cookies (third party).
- No cookie banner and therefore no cookie at all.
- No advertising.
On the side of free technical solutions that allow analytics oriented log analysis, there is obviously the good old AWStats . But I find that its interface and its functionalities are a bit old. That’s why I’m presenting you today GoAccess ! I have used this solution many times in professional contexts and it is always very practical.
Installation of GoAccess
For my article, I deal with the installation of GoAccess on a Debian server with an Apache web server.
But the software is available on most Linux distributions here . Moreover, it is able to read the logs of almost all types of web servers: “Apache, Nginx, Amazon S3, Elastic Load Balancing, CloudFront, etc.” - Source
Under Debian 11.5, you will get the version 1.4 of GoAccess in the repositories, but nothing prevents you from adding their sources to get the last updated version.
Finally, GoAccess offers the consultation of statistics by web interface (dashboard) and/or command line.
Debian installation :
|
|
For Command Line use, you can directly consult the statistics in real time in your terminal with :
|
|
Setting up the GoAccess dashboard for Apache
Once the package is installed, it is necessary to configure the /etc/goaccess.conf file. This file is organized in sections with lines to comment/uncomment to enable/disable certain options.
For the Apache web server, you will need to uncomment the following line for the Time Format Options section:
|
|
For the Date Format Option section, uncomment the following line:
|
|
Finally, in the Log Format Option section of the conf file, I’m using Apache with combined VHOST and logs, so I’ll have to uncomment the :
|
|
And :
|
|
Finally, it is possible, as a test or to share an analysis, to launch a parsing on a log and to get an HTML file ready to use or to share. Example with this command:
|
|
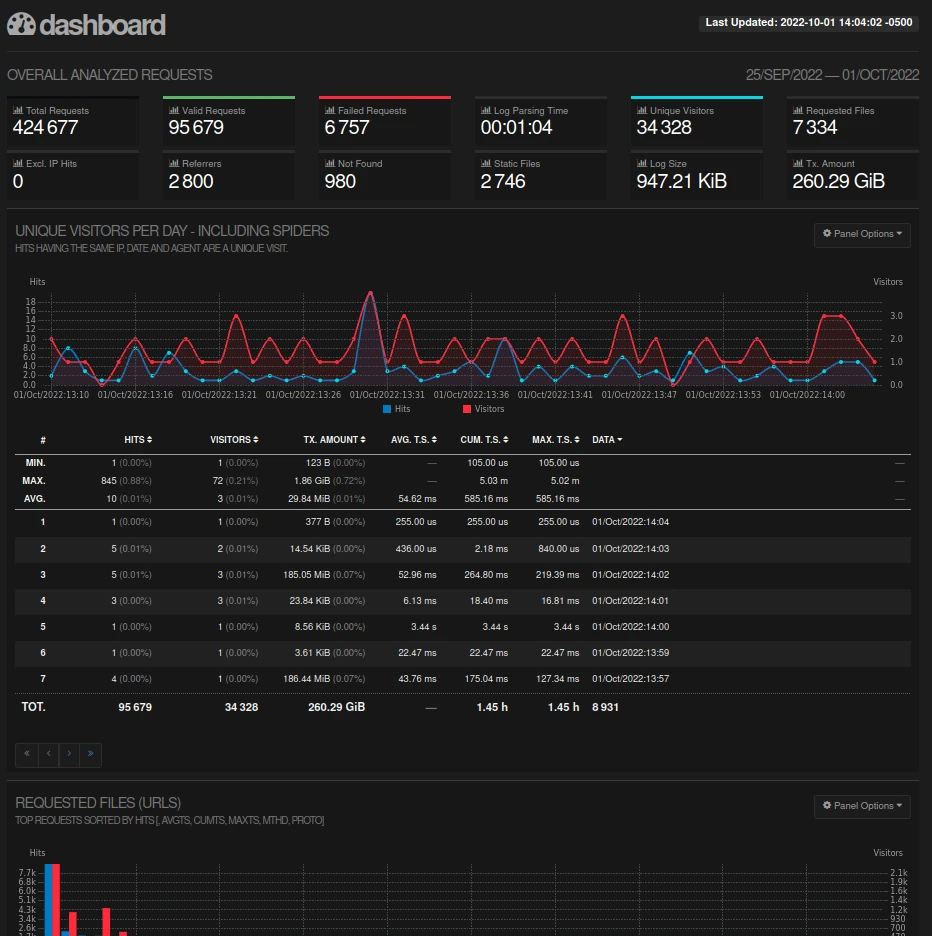
Before attacking the rest, you can already take a look at your first generated dashboard !
 For privacy reasons, this is a capture of the GoAccess demo
.
Automate log analysis and make the dashboard available
For my example in the article, I want to:
- Update the report 1 time per hour.
- Make the dashboard (static HTML file) available under:
domain.fr/goaccess. - Lock access to the dashboard with a password.
- Turn off IP addresses in the report for more confidentiality (if you need to show/share statistics).
- In the VHOST of your domain, lock access to the report:
|
|
Use htpasswd to manage your authentication via apache
.
- Add the automation of the dashboard generation in your
cron:
|
|
To truncate IP addresses, we use the --anonymize-ip option in GoAccess. Level 2 of this option corresponds to masking of 16 bits in IPv4 and 80 bits in IPv6.
GoAccess dashboard options
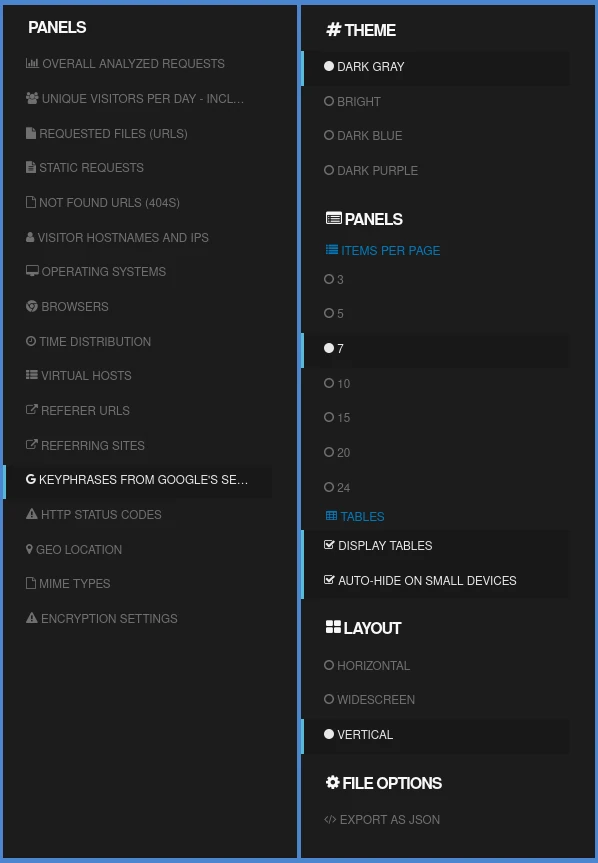
A GoAccess analytics report is a simple HTML static file. On this page, you will find a menu on the left allowing you to edit display parameters as well as menus linking you to the different HTML anchors of the dashboard. You can also choose to show or hide certain anchors.

The last word…
To conclude, you should know that GoAccess has multiple options and I urge you to dig into their documentation if you are interested. For example, there is an option to display your real-time statistics . GoAccess will mount a Websocket server to refresh the data constantly, perfect 👌.
Find a live demo of the GoAccess dashboard here: rt.goaccess.io .
There will certainly be many more of you reading this new article, at least I’ll know soon thanks to GoAccess 😉.
